Calculator
Pick the same filter layout and size you built with, then enter the two pressure readings from a phone sealed inside the box. Readings are in hPa, exactly as phyphox shows them.
How to run the test
Seal an Android or iOS phone inside the box, read the pressure with the fans off and then on, and enter both numbers in the calculator above. Work quickly, the barometer drifts as it warms.
1Set up phyphox
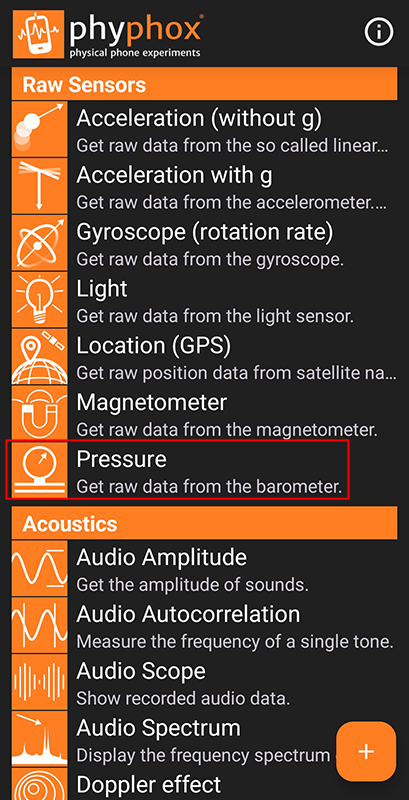
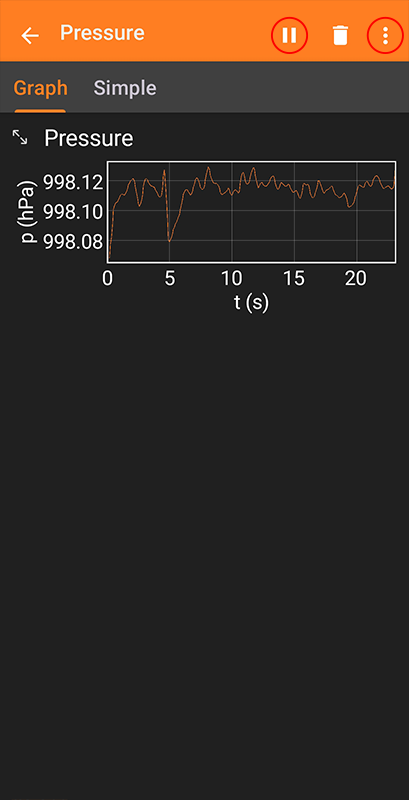
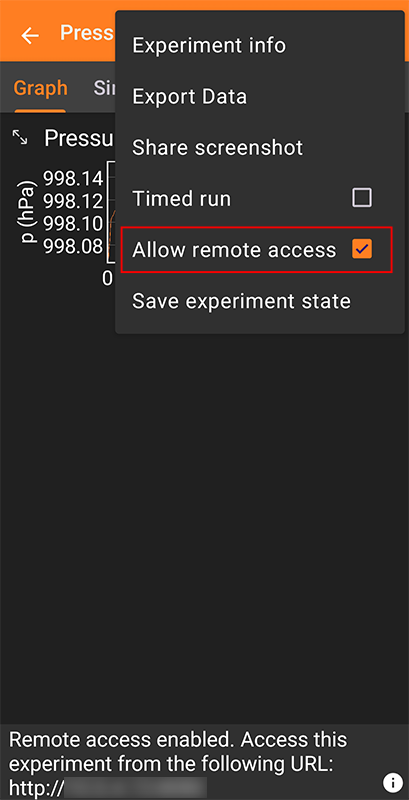
Install phyphox (free) on a phone that has a barometer (many Android and most iOS models do), open the Pressure experiment, press play, and turn on Remote Access so you can read it live from another device on the same Wi-Fi network.
2Seal the phone inside the box
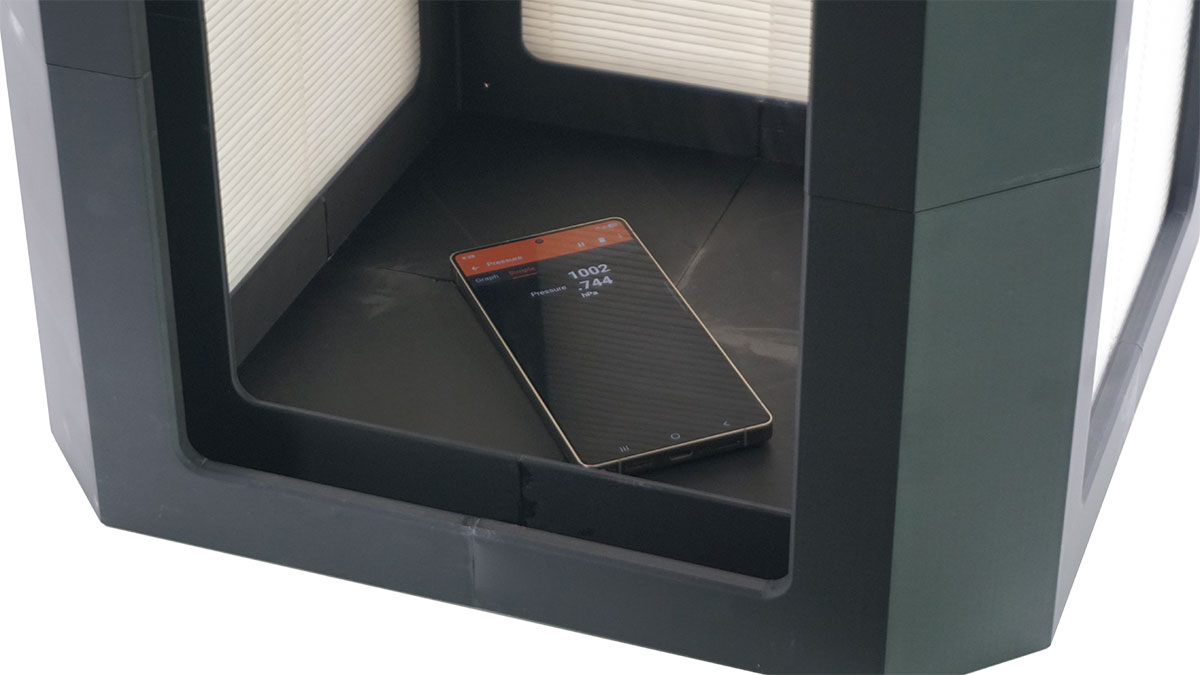
Put it in before you close up the last filter so the box stays as sealed as it is in normal use. The phone reads the pressure inside the box.
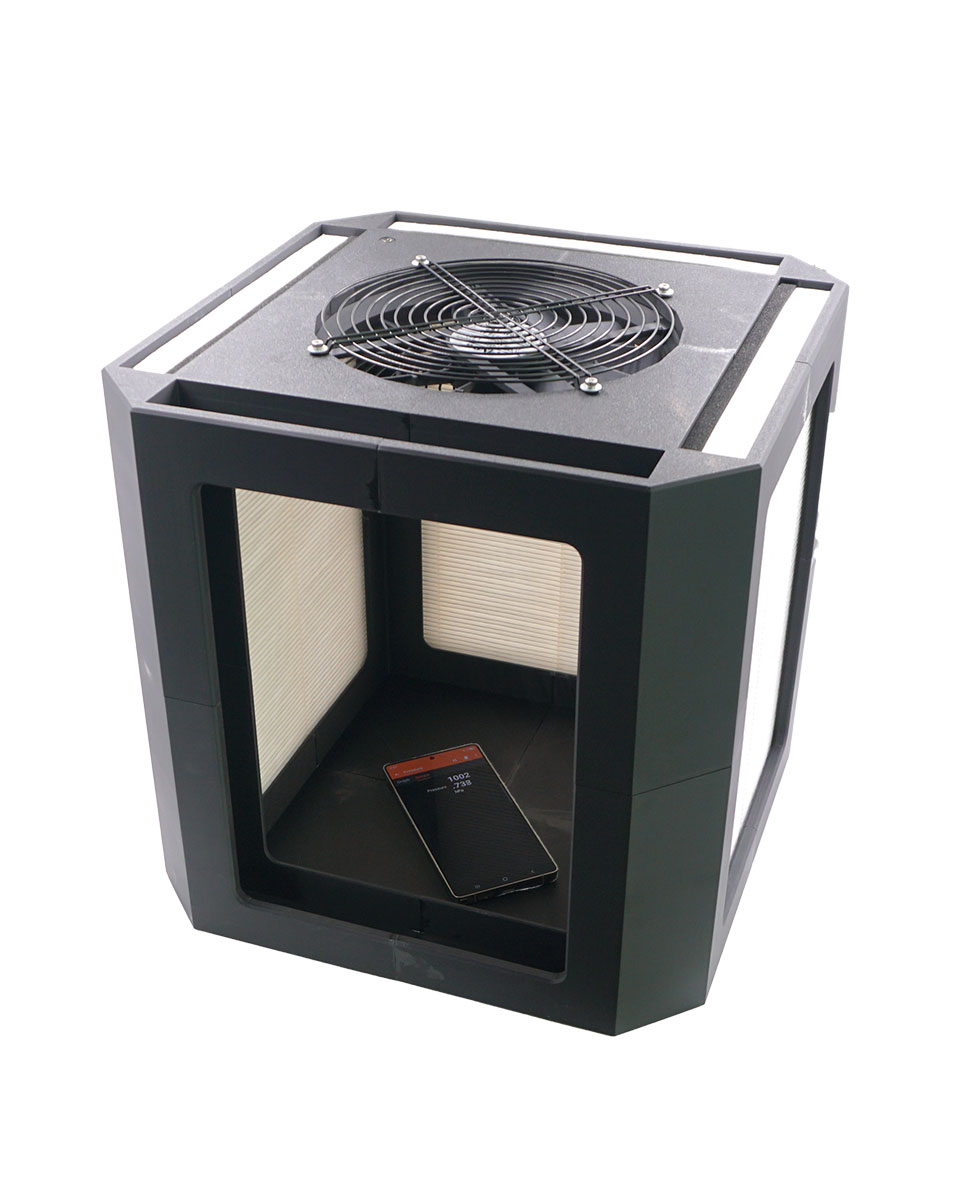
3Read the baseline (fans off)
With the fans off, read the pressure and write it down. This is your baseline; with no flow, the inside of the box is at room pressure.
4Read with the fans on
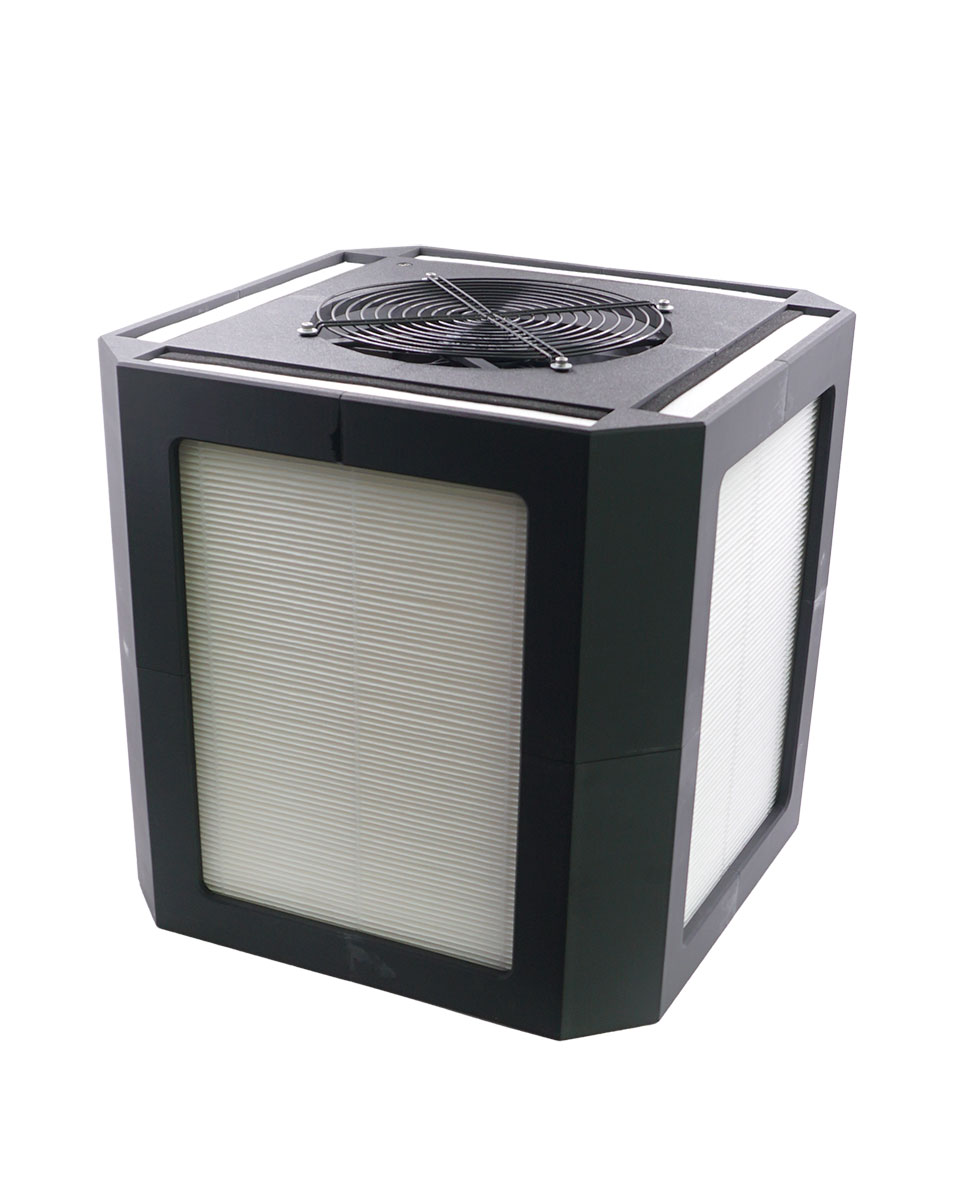
Turn the fans on at the speed you normally run them. Wait 5 seconds for them to reach full speed, then read the pressure again.
5Work quickly
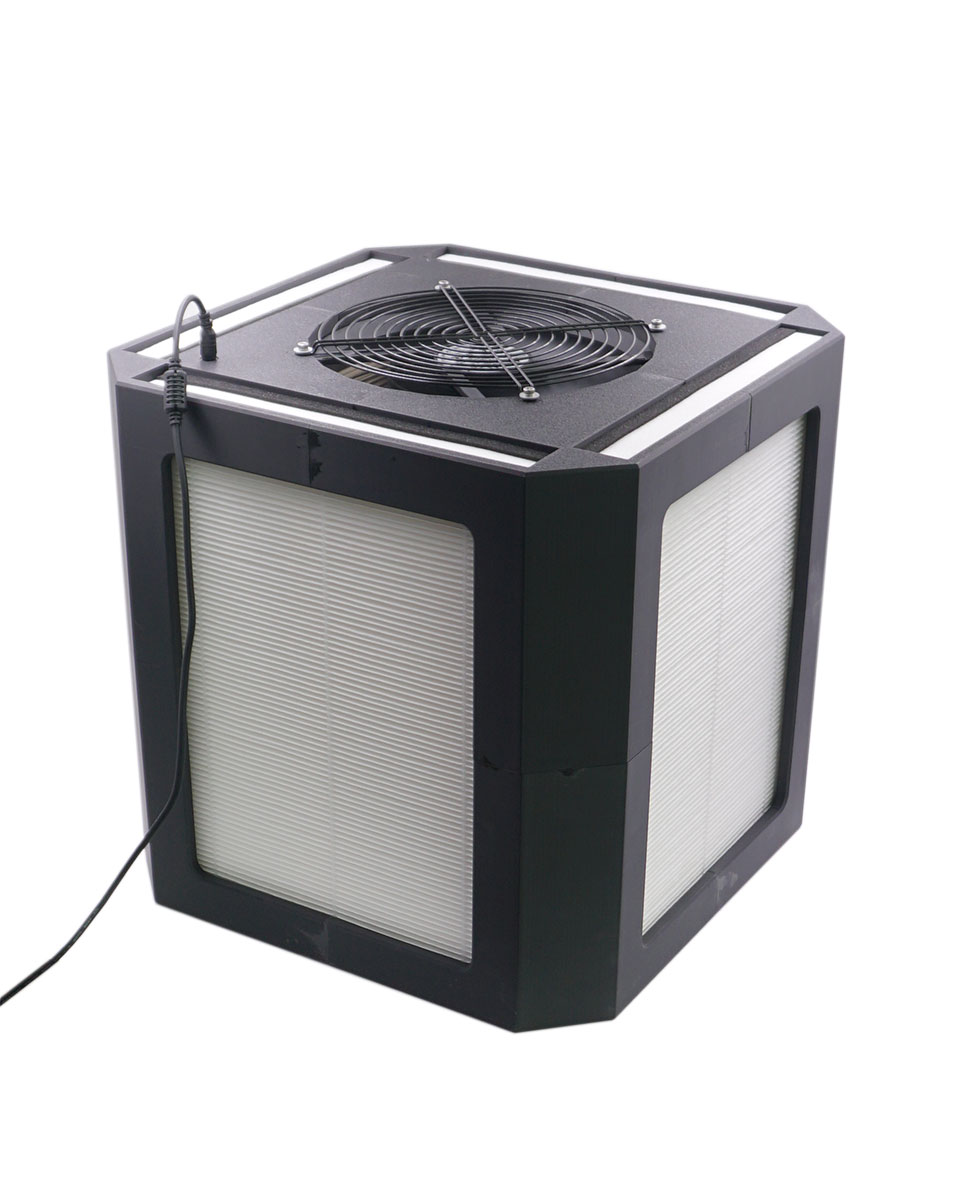
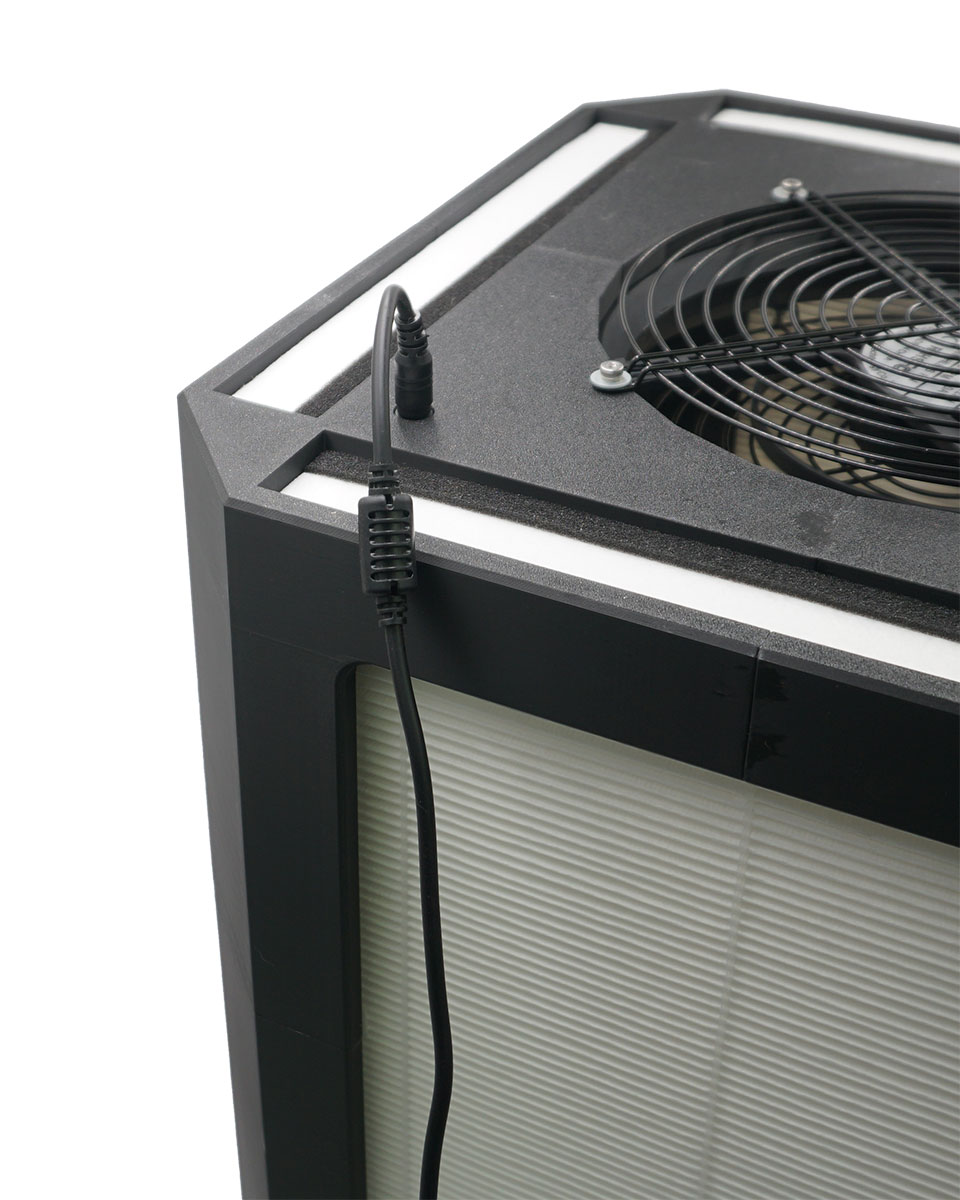
Phone barometers drift as they warm, so take both readings within 20 seconds or so, and write down the center of the small range the reading wanders through rather than waiting for it to settle.
6Enter your readings
Enter both readings, the layout, and the filter size in the calculator above.
The math
The pressure drop across the filters is just the difference between the two readings:
A MERV-13 filter's resistance follows a known curve, so a given ΔP corresponds to a particular face velocity (the speed of air through the media, in feet per minute):
Solving that for V and multiplying by the total effective media area of all the filters gives the
airflow through the filters. The clean air delivery rate is that airflow times the filter's single-pass
capture efficiency:
The resistance curve, the effective-area model (deeper filters pleat more media in), and the MERV-13 efficiency (about 81%, averaged across the 0.3 to 10 µm range) are the same ones the builder uses to predict CADR. Here they run in reverse, from a real measurement instead of a fan-and-filter model.
What it tells you, and what it does not
- It estimates clean air delivery rate: the volume of filtered air per hour, counting only what the filters actually clean. Higher is better.
- It assumes MERV-13 media, the filter type the builder is designed around. A different filter has a different resistance and efficiency, so the estimate would be off.
- It assumes the box is reasonably sealed, so the pressure the phone sees really is the drop across the filters. Big leaks will throw it off.
- Phone barometers read in steps of about 1 Pa with a few Pa of noise and drift, so treat the result as a ballpark, most useful for comparing builds or fan choices rather than as an exact figure.
- This is a rough field estimate, not a certified CADR chamber test.